Conduction abnormalities
Authors: Andrew Restivo, MD, Jacobi Montefiore Hospital, New York; Marianne Haughey, MD and Chrisina Hajicharalambous DO, SBH Health System, New York
Editor: Julianne Jung, MD, Johns Hopkins Medical Center, Baltimore, Maryland
Introduction
Normal electrical conduction through the heart muscle takes a predicted pathway. It travels from the Sinoatrial node (SA node) to the Atrioventricular node (AV node) to the Bundle of His and then onto the left and right bundle branches (usually in a left to right pattern), ultimately ending up in the Purkinje fibers. Additionally, the Left Bundle has an anterior and posterior component called a fascicle. In normal cardiac electrophysiology, the electrical conduction occurs from left to right, essentially stimulating the left bundle, and left ventricle first. This chapter will discuss the syndromes that result in abnormal conduction at every step of the electrical pathway, the aberrations that are manifested in the ECG as a result and the relevance of each abnormality in a clinical setting. Abnormalities that manifest outside this conduction pathway, congenital and acquired will also be captured in this chapter.
Atrioventricular (AV) Blocks
Electricity travels from the SA node to the AV node as part of its initial electrical pathway. The AV node is one of the first areas where conduction abnormalities can be detected on an ECG. AV nodal blocks can have an intrinsic delayed firing or a barrier to firing down the Purkinje system and as a result can cause bradycardias and hypoperfusion to vital organs. Cardiac ischemia, infarction, degenerative disease and infiltrative disease can all lead to AV nodal block.
One of the easier blocks to identify is a first degree AV block. In this block, intrinsic conduction through the AV node is delayed, which lengthens the time from atrial depolarization (p wave) to ventricular depolarization (QRS complex). As a result, the distance between the two depolarizations (the PR interval) is prolonged. In a first degree block, the PR interval is greater than 200 msec (Figure 1). Typically these blocks are not clinically significant, and can be caused by a variety of conditions. This rhythm is typically the least dangerous, requiring nothing more than routine follow up.
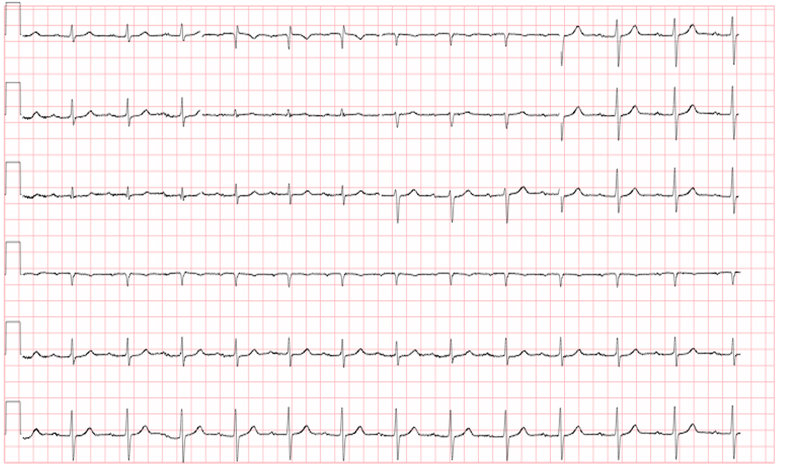
Figure 11stdegree AV block
Courtesy of Dr. Rahul Patwari, Rush University
Second degree heart block includes two subtypes: Mobitz type 1 (also known as Wenckebach) and Mobitz type 2. The relationship between the P and the QRS are essential in differentiating between these blocks.
In Mobitz type 1, the PR interval progressively lengthens until the time of conduction is so great that the ventricle is unable to conduct, and there is a “dropped beat,” or absence of the QRS complex after the p wave (Figure 2). Similar to first degree, Mobitz type 1 block does not usually require an emergent intervention such as a pacemaker, although evaluation (medication history, blood testing, echocardiography) is usually performed to rule out reversible causes. Often causes are not found to be in the node itself, but in other contributing delayers of conduction.
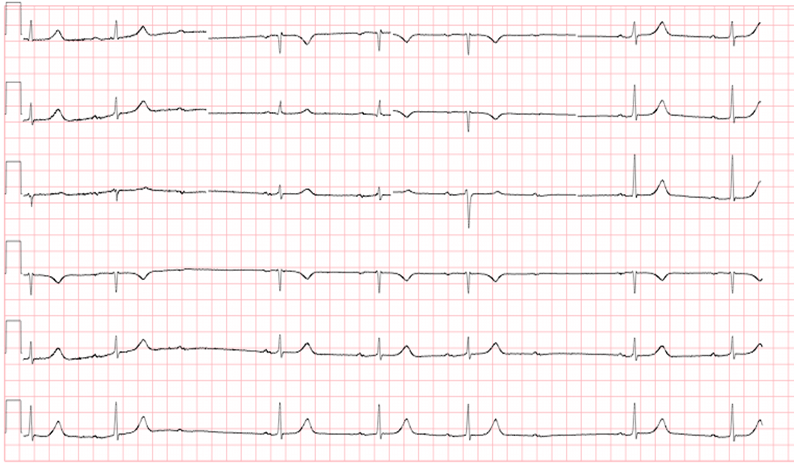
Figure 2 Mobitz Type I
Courtesy of Dr. Rahul Patwari, Rush University
Mobitz type 2 (Figure 3) is actually more dangerous, in that the electrical conduction is more episodic between the atria and the ventricle, and is more likely to be due something intrinsic within the myocardium itself. Although the PR interval remains constant without progressive lengthening, there are intermittently dropped beats. These may occur at regular intervals, or may be unpredictable. Structural issues of the myocardium are typically to blame for this phenomenon (i.e. cardiomyopathies, myocardial infarctions, myocarditis, etc). This heart rhythm is essential to recognize as there is high likelihood of progression to 3rd degree heart block.
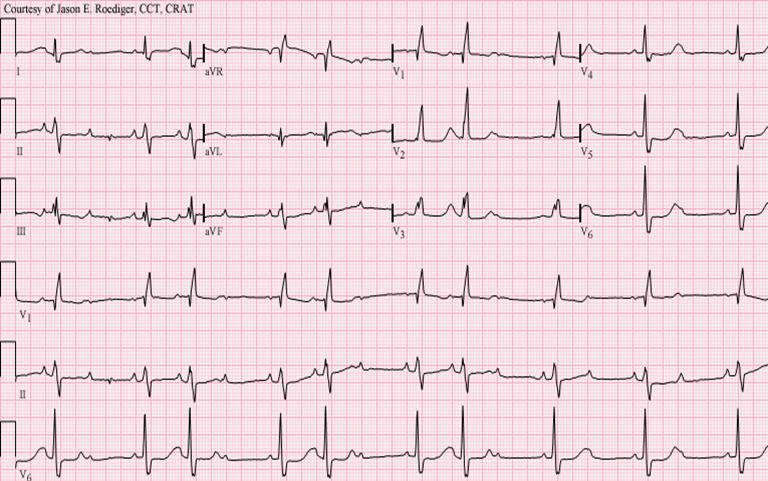
Figure 3 Mobitz Type II
Courtesy of user Jer5150 https://commons.wikimedia.org/wiki/File:Sinus_rhythm_with_3-to-2_and_2-to-1_Type_II_A-V_block.png
In third degree heart block, the electrical depolarization of the atria and the ventricles occur independently of each other. This is recognized when the P waves and the QRS complexes “march through” the rhythm strip, each at their own independent rate, without regard to each other (Figure 4). As can be seen in the figure, the P wave rate is 60 beats per minute (blue arrows) and the QRS rate is 37 beats per minute (black arrows). If you examine only a few beats on a 12 lead ECG, there may seem to be a relationship between the P waves and QRS complexes. However, when observed over a longer strip, it is readily apparent that the atrial and ventricular rhythms are not associated with one another, but instead are firing (“marching through”) at separate rates, independently of one another. This pattern almost invariably presents with the ventricular rate being slower than the atrial rate, and can lead to life-threatening bradycardia.
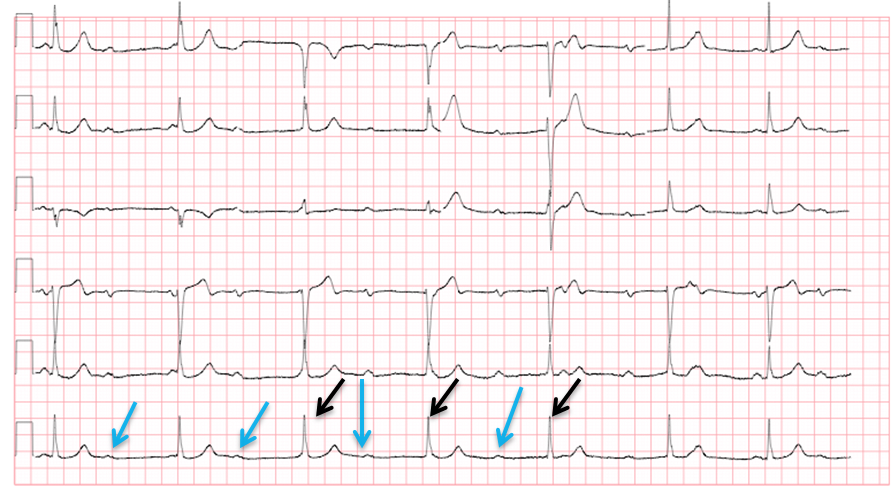
Figure 4 Third degree heart block
Courtesy of Dr. Rahul Patwari, Rush University
Both Mobitz 2 and third degree heart blocks require pacemaker placement. This should be done on an emergent basis if the patient is significantly hypotensive, or if they are severely symptomatic at rest (e.g., pre-syncope, dyspnea, chest pain, etc). Pacemaking ensures an adequate ventricular rate to maintain cardiac output and perfuse vital organs.
Wide vs narrow QRS
Moving along down the electrical pathway, the AV node transmits its electrical signal to the bundle of His and the Purkinje system depicted by the QRS complex of the ECG. One of the most important issues to evaluate in looking at an ECG is the width of the QRS. If the impulse is following the normal pathway described above, the resulting QRS should be normal or about 90 to 120 msec since there is no impedance of flow to the electrical activity. A wider QRS indicates that conduction is occurring through an abnormal pathway. The wider QRS is indicative of the delay in conduction as it takes longer for electrical activity to travel from myocyte to myocyte compared to the electrical conducting system. This can be depicted in bundle branch blocks, or the rhythm may be originating from below the atrium in either the ventricle or more proximally in the conduction pathway (Figure 5).
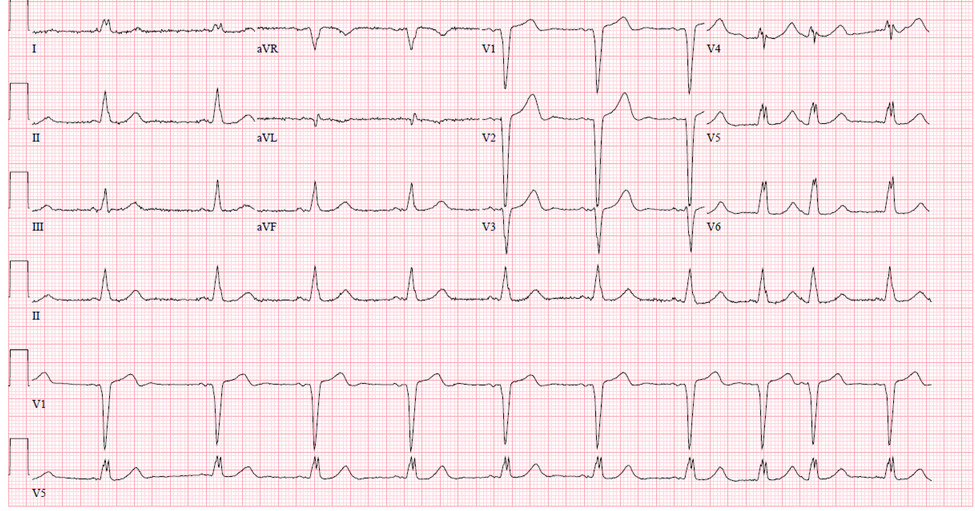
Figure 5 Wide complex QRS rhythm
Courtesy of Dr. Corey Heitz, Virginia Tech Carilion School of Medicine
Bundle Branch Blocks
Certain pathologies (e.g., MI, pulmonary HTN, digoxin toxicity, etc) can result in an interruption to any part of the electrical conducting system. Clinically, bundle branch blocks are a delay in the conduction pathway and they can be helpful in determining the underlying etiology to a patients’ presenting complaint. They can The left and right bundle branches can each be affected, producing a recognizable pattern on the ECG which may help elucidate the etiology of a patient’s symptoms (eg., dyspnea, chest pain, presyncope).
When either bundle branch is blocked, the electrical impulse must travel directly from myocyte to myocyte, a much slower process than traveling through the normal low-resistance pathways. As a result of this pathophysiology, the conduction time through the ventricles is prolonged, resulting in widening of the QRS complex (greater than 120 msec).
In a left bundle branch block (LBBB), the normal direction of activation is reversed, meaning that the right bundle branch is activated first, followed by the left bundle. This produces tall R waves in the lateral leads (I, aVL, V5, V6) and deep S waves in V1-V3 (Figure 6).

Figure 6Left Bundle Branch Block
In a right bundle branch block (RBBB), the impulse direction remains normal, meaning that the left bundle is activated first, followed by the right bundle. However, the impulse is delayed in reaching the right bundle. As a result, an “R-prime” or secondary R wave is observed in the precordial leads (V1-V3), and the S wave is slurred in the lateral leads. In the precordial leads, the appearance is often referred to as the “bunny ears”, indicating the RSR prime complex. ST- depression and T wave inversions are also a common feature of RBBB in the right precordial leads (V1-V4) (Figure 7).
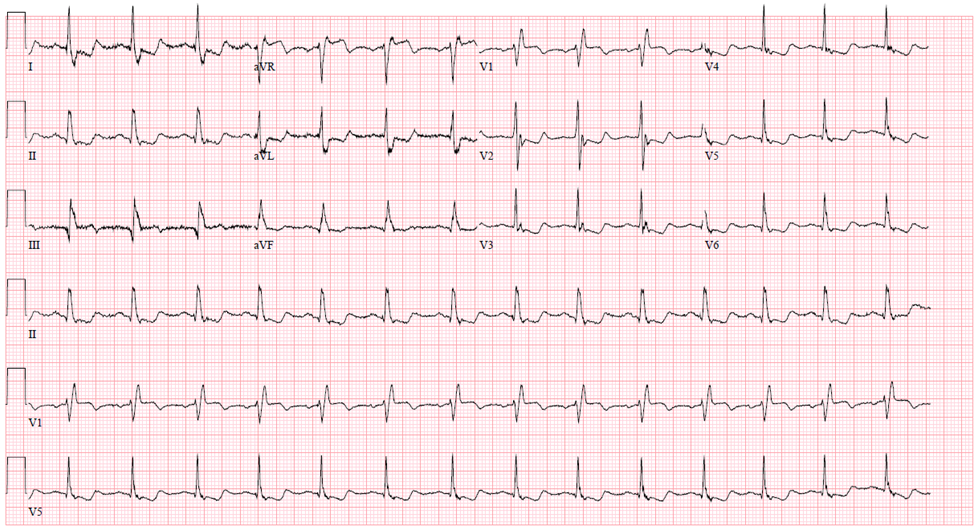
Figure 7Right Bundle Branch Block
Congenital Conduction Disturbances
Wolff-Parkinson White
Certain accessory pathways can predispose to tachydysrhythmias. By definition, an accessory pathway allows for electrical conduction through the heart at sites other than the normal anatomic locations. This pathway circumvents the normal regulatory mechanisms that are in place when the SA and AV nodes fire. The conduction system normally becomes refractory to new electrical stimuli for a period after firing an action potential. Accessory pathways are not subject to this refractory period, potentiating tachydysrhythmias. One well-known disease involving an accessory pathway is Wolff-Parkinson-White (WPW) Syndrome. In WPW, the accessory pathway is called the bundle of Kent. The characteristic ECG feature of WPW is a delta wave (“slurring” of the upstroke of the QRS) and a shortened PR interval. This pathognomonic finding is the result of premature excitation of the cardiac myocytes (Figure 8).
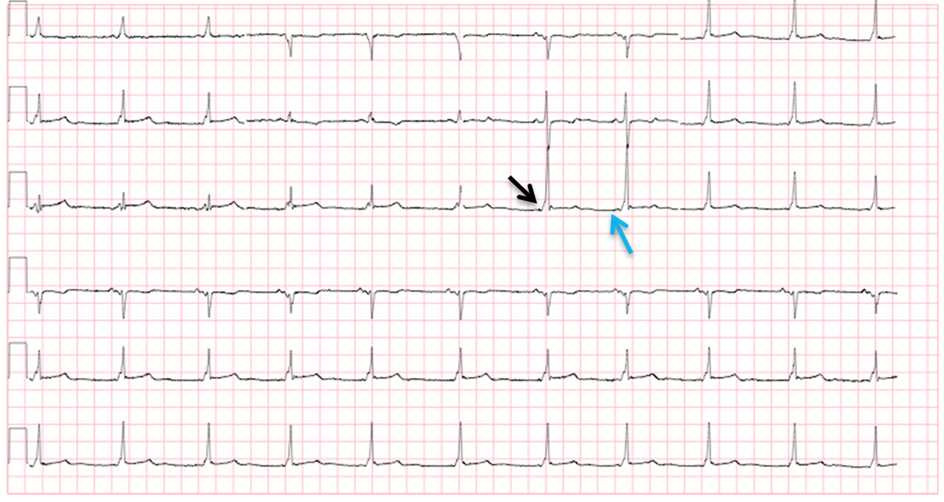
Figure 8 WPW. Arrows indicate delta waves (black arrow) and a shortened PR interval (blue arrow)
Courtesy of Dr. Rahul Patwari, Rush University
Long QT Syndrome
Long QT syndrome is a congenital syndrome that can go undiagnosed for years. It is a conduction abnormality in ventricular repolarization that presents on an ECG as a prolonged QT. The QT interval must be corrected for heart rate, as faster heart rates will normally have a shorter QT interval than will slower heart rates. The most common formula used for this purpose is Bazett’s Formula, which is the QT Interval divided by the square root of the RR interval ().
Normal QTc ranges between 330 to 440 msec. A QTc greater than 440 msec is considered prolonged. Prolongation of the QT interval greater than 500 msec is concerning, as it can lead to cardiac dysrhythmias, namely Torsades de Pointes (Figure 9) that can ultimately decompensate to ventricular fibrillation.
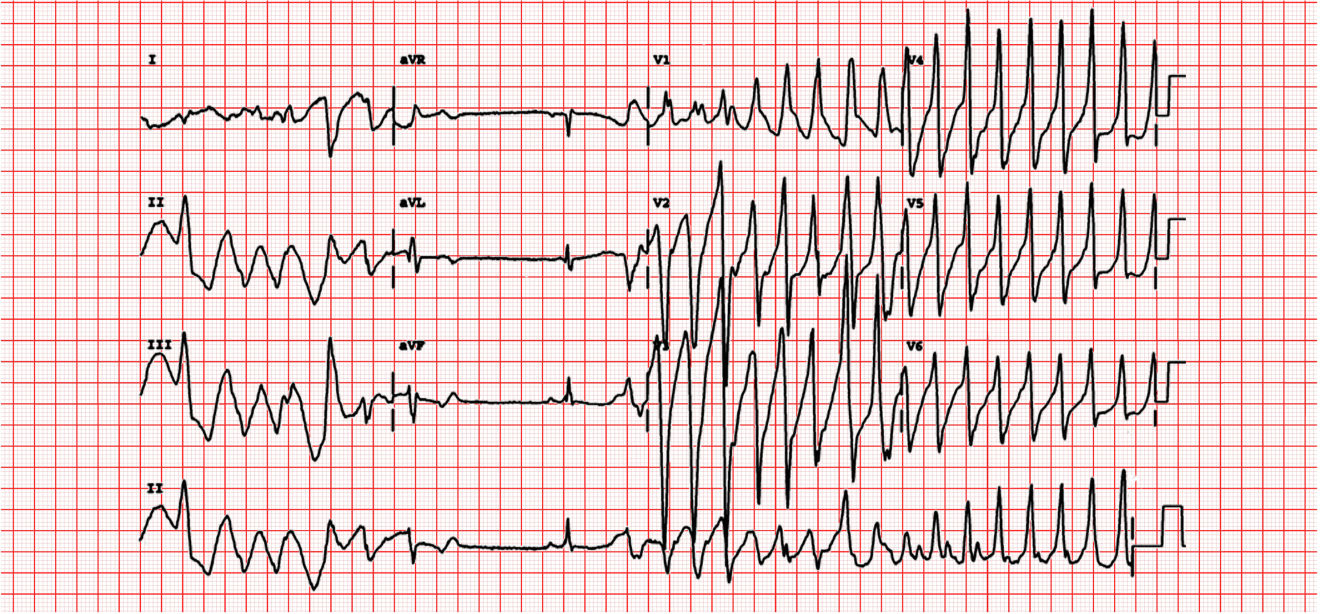
Figure 9 Torsades de Pointes
Courtesy of Michael Rosengarten BEng. MD McGillhttps://commons.wikimedia.org/wiki/File:112_(CardioNetworks_ECGpedia).jpg)
Patients with Long QT syndrome can present with an array of symptoms including dizziness, presyncope, syncope, or cardiac arrest. Many long QT patients are found incidentally on ECG, and are not symptomatic. Medications can be the inadvertent cause of QT lengthening on ECG. Symptomatic long QT syndrome can be fatal. After initial stabilization, long QT syndrome can be treated with beta blockers. Some patients will meet criteria for an implantable cardiac defibrillator for primary prevention given their risk of sudden cardiac death. Specifically, patients that are at higher risk include those with a QTc above 500msec, cardiac events despite medical therapy and those with a history of cardiac arrest as a result of prolonged QT decompensated to fatal arrhythmia. Family members should also be encouraged to be screened for Long QT syndrome as it can be inherited.
Brugada Syndrome
Just as genetic anomalies may affect conduction pathways in the heart, there are genetic anomalies that affect the heart at the molecular level as well. The Brugada syndrome is caused by defects in the sodium/calcium channels located on myocyte membranes. From these channelopathies, patients are predisposed to ventricular tachycardia, ventricular fibrillation and sudden cardiac arrest. Just like WPW, the ECG is also essential to the diagnosis for Brugada syndrome.
There are three types of Brugada syndrome, each distinguished by their particular precordial ECG findings. Type I is characterized by pronounced, coved ST segment elevation. In Type II, the ST segment is elevated in a saddleback pattern. Type III is characterized by a more subtle ST segment elevation. (Figure 10) These ECG findings are often detected in asymptomatic patients. However, in this case, asymptomatic does not mean “well.” Their predisposition to fatal tachyarrhythmia remains and must be addressed. If their clinical presentation can be attributed to a finding of Brugada on ECG, i.e. syncope or an unstable cardiac rhythm, patient will require admission with cardiac monitoring and cardiac consultation for possible defibrillator implantation. Brugada syndrome found as in incidental finding in an otherwise stable and symptomatic patient can be discharge with prompt cardiology follow up. As there is a genetic predisposition to this syndrome, it is also important to advise that family members be screened as well.
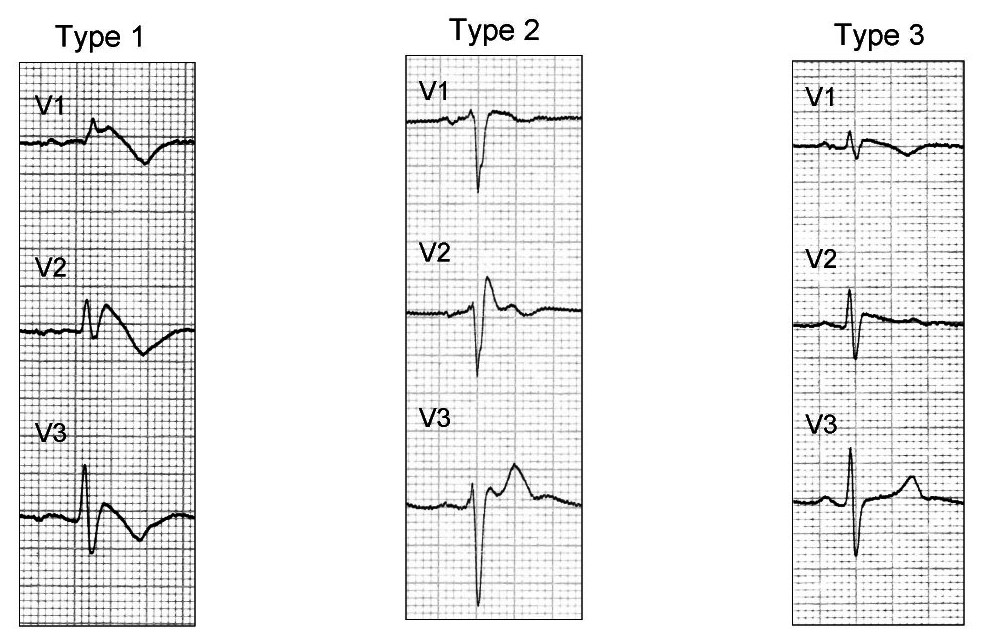
Figure 10 Brugada Types
Brugada Syndrome, Flip EM, Wikipedia Commons
Acquired Conduction Disturbances
Hypothermia
In hypothermia, cooling of the myocardium can increase the epicardial potassium current during ventricular repolarization. This results in a positive deflection of the J point, predominantly in the precordial leads. Oftentimes, the height of the deflection is proportional to the degree of hypothermia. Keep in mind, however, that Osborne waves can also be seen as a normal variant, in brain injuries, i.e. subarachnoid hemorrhages, with certain medications, and as a result of hypercalcemia (Figure 11).
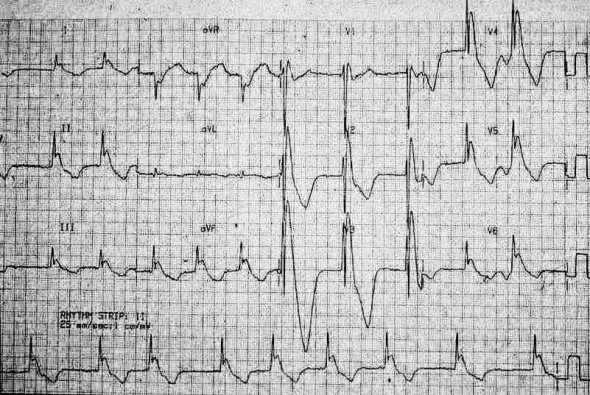
Figure 11 Osborne waves seen in moderate hypothermia (top image temp < 30 degrees C) and severe hypothermia (bottom image, temp < 27 degrees C)
Courtesy of Dr. Mike Cadogan, lifeinthefastlane.com
References
Chan TC, Brady WJ, Harrigan RA, Oranato JP, Rosen P. ECG in Emergency Medicine and Acute care. 2005. Elsevier Mosby. New York, NY.
Garcia TB, Holtz NE. 12-lead ECG: the Art of interpretation. 2001. Jones and Bartlett Publishers. Sudbury, Massachusettes.
Peacock WF, Tiffany BR. Cardiac Emergencies. 2006. McGraw-Hill: New York, NY.
Zimmerman FH. Pre-test: Self Assessment and Review- Clinical Electrocadiography. 1994. McGraw Hill. New York, NY.